South Jersey Housing Market Update: September 2026 Prices, Inventory & Sales

Derek Doernbach, Realtor®
Century 21 Action Plus Realty | Your Jersey Shore Team
Published October 28, 2026
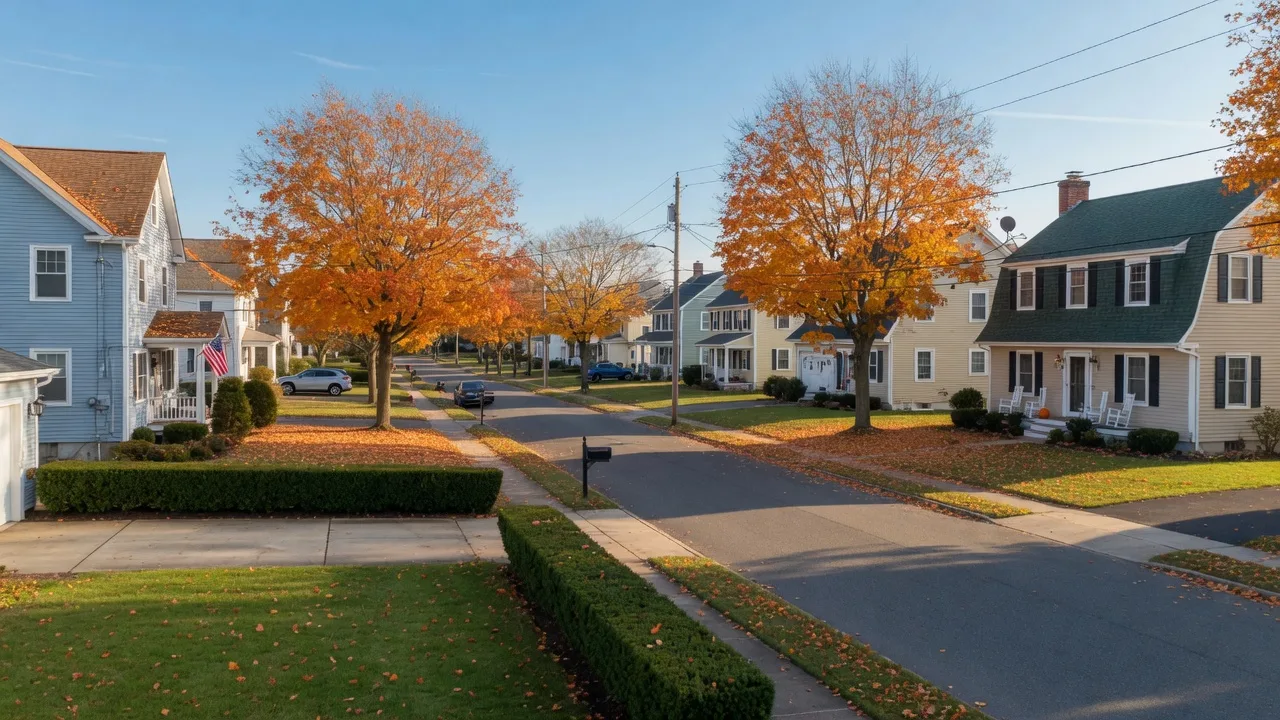
Through September 2026, New Jersey's single-family market kept rising in price while slowing in activity. The statewide September median sales price was $614,000, up 5.0% from September 2025, and Atlantic County's September median climbed 11.9% to $469,775, according to the September 2026 New Jersey REALTORS® local market reports. At the same time, closed sales and pending contracts fell statewide, and available inventory grew, a combination that gives buyers more choices and sellers a more realistic pricing conversation than they faced a year ago.
This report is for homeowners, sellers, and buyers across Atlantic County and South Jersey, the counties I serve with Your Jersey Shore Team at Century 21 Action Plus Realty. It covers the statewide September numbers, a close look at Atlantic County, and what is confirmed so far for Ocean, Cape May, Cumberland, Camden, Gloucester, Salem, and Burlington counties, with sources and reporting notes so you can check the work yourself.
September Median Sales Price
$614,000
+5.0% vs. September 2025
September Closed Sales
4,983
−6.5% vs. September 2025
September Pending Sales
4,342
−12.8% vs. September 2025
September Months of Supply
3.1
Single-family, statewide
All four cards are single-family, New Jersey statewide figures from the September 2026 New Jersey REALTORS® report.
Market Terms Used in This Article
- Median sales price
- The median is the middle sale price: half of the sales were above it and half below it. A higher median can reflect changes in the types, locations, sizes, or price ranges of homes that sold.
- Months of supply
- Months of supply relates available inventory to the recent pace of pending sales. In the New Jersey REALTORS® reports, it is calculated using inventory at month-end divided by average monthly pending sales over the preceding 12 months. It is not a prediction of how long an individual listing will take to sell.
- List price received
- List price received describes the reported relationship between sale prices and list prices. A figure below 100% means sales closed below the asking-price benchmark in aggregate; it does not mean every sale in the period went under asking.
New Jersey's Single-Family Market at a Glance
Statewide, the September single-family median sales price rose while closed sales, pending sales, and the pace of activity cooled. New listings increased modestly, and the inventory cushion grew.
September single-family metrics, New Jersey statewide
Median sales price
- September 2025
- $584,500
- September 2026
- $614,000
- Change
- +5.0%
Closed sales
- September 2025
- 5,330
- September 2026
- 4,983
- Change
- −6.5%
Pending sales
- September 2025
- 4,979
- September 2026
- 4,342
- Change
- −12.8%
New listings
- September 2025
- 7,157
- September 2026
- 7,321
- Change
- +2.3%
Homes for sale (all property types)
- September 2025
- 20,294
- September 2026
- 22,746
- Change
- +12.1%
The statewide single-family-only homes-for-sale count and months-of-supply comparison from a year earlier were not confirmed in the September report excerpts at publish time. September 2025 baseline values in this table are derived from the published September 2026 figures and their reported year-over-year changes; the source report displays its own rounded values. n/r = not reported or not confirmed at publish time.
Year to date through September, New Jersey REALTORS® data showed the statewide single-family median up 3.8% compared with the same period in 2025, and new listings up 4.2% to just over 65,000 for the period. Those year-to-date comparisons smooth out the swings of any single month.
The picture is a market that is still appreciating but moving more slowly. For comparison, the August 2026 report I covered last month showed a statewide August median of $644,500, up 3.1%, with roughly 13,900 single-family homes on the market and 2.9 months of supply.
September in Atlantic County: Prices Still Climbing, Pace Cooling
Atlantic County's September single-family median sales price was $469,775, up 11.9% from September 2025, per the New Jersey REALTORS® Local Market Update. That continues the county's 2026 pattern of year-over-year median gains, following a 10.8% year-to-date increase through August (a January–August 2026 median of $445,000).
September 2025 baseline values in this table are derived from the published September 2026 figures and their reported year-over-year changes; the source report displays its own rounded values. Days on market, months of supply, and list price received were not confirmed for September 2025. n/r = not reported or not confirmed at publish time.
Atlantic County September single-family metrics
Median sales price
- September 2025
- $419,700
- September 2026
- $469,775
- Change
- +11.9%
Closed sales
- September 2025
- 247
- September 2026
- 211
- Change
- −14.6%
Days on market
- September 2026
- 40 days
Months of supply
- September 2026
- 4.2 months
List price received
- September 2026
- 98.5%
The Atlantic County numbers tell two stories at once. On the price side, an 11.9% year-over-year gain in the September median keeps the county among the fastest-appreciating markets in South Jersey, and well ahead of the statewide 5.0% increase. On the activity side, closed sales fell 14.6%, the county's months of supply reached 4.2, and the reported list-price-received figure of 98.5% means that, in aggregate, September's sales were closing below asking price. None of that means prices are falling; it means negotiations have shifted since the years when nearly every listing drew multiple offers.
Where you look inside the county matters a great deal. The mainland towns of Egg Harbor Township, Hammonton, Northfield, Linwood, and Somers Point behave differently from the barrier-island markets of Margate, Brigantine, and Atlantic City. A county median is a benchmark, not a price tag for an individual street, and seasonal fall activity in shore towns is different from year-round mainland demand. That is exactly why the September figures need a town-level conversation before any pricing decision.
How Did Other South Jersey Counties Do in September?
The table below gathers the September 2026 figures I could verify at publish time from each county's report or a documented market snapshot, labeled by source so the methodologies stay transparent. The New Jersey REALTORS® Local Market Update and Long & Foster reports follow their own definitions, and the remaining entries are MLS-based county market snapshots rather than a single uniform dataset, so the rows are not perfectly apples-to-apples.
September 2026 median sale prices by county
Atlantic County
- Median
- $469,775
- Change
- +11.9%
Source: NJ REALTORS® LMU
Ocean County
- Median
- $501,000
- Change
- −2.0%
Source: Long & Foster report
Camden County
- Median
- $376,950
- Change
- +4.7%
Source: MLS county snapshot
Gloucester County
- Median
- $385,000
- Change
- +7.4%
Source: MLS county snapshot
Cumberland County
- Median
- $280,000
- Change
- +3.7%
Source: MLS county snapshot
Salem County
- Median
- $270,900
- Change
- +2.2%
Source: MLS county snapshot
Cape May County: I could not verify a county-level September 2026 median at publish time, so I am not printing one. What the sources do confirm: New Jersey REALTORS® data through May 2026 showed Cape May County's year-to-date median up 19.7% (nj.com, July 10, 2026), and NJ REALTORS-based reporting indicates Cape May sellers received the lowest share of asking price of any county in September, with roughly 4.5 months of condo supply, a market where pricing is especially sensitive. For Ocean City and the rest of Cape May, the practical resource remains my seller's guide to Ocean City.
Burlington County: published September figures conflicted across the report versions I checked at publish time (the NJ REALTORS® county page and an MLS-based snapshot disagreed on both median and closed-sales direction), so I am not reporting a Burlington number this cycle rather than pass along a figure I cannot reconcile. I will flag it again when the October data is released.
One important caution: Salem County closed just 58 sales in September, a market small enough that a single month can move percentages sharply. Treat small-county percentages as directional, not as a trend.
What the September Numbers Mean for South Jersey
Read together, the September figures describe a market that is rebalancing rather than collapsing. Prices are up in most counties, but the volume of closed sales is down almost everywhere, pending contracts fell sharply statewide, and inventory is measurably higher than a year ago. That combination typically means three things locally:
- Buyers have more choice and more leverage. More homes on the market, longer days on market, and list-price-received figures below 100% in Atlantic County mean a well-prepared buyer can negotiate on price, repairs, and closing timing in ways that were difficult in 2022 through 2024.
- Sellers can no longer assume multiple offers. Pricing a property to its real comparable sales and presenting it well is what separates homes that sell in the first 30 to 40 days from homes that accumulate showings but no offers.
- The mortgage-rate backdrop still shapes everything. For a plain-English explanation of what actually drives borrowing costs and how that flows into buyer demand, see my post on who really controls mortgage rates.
None of this applies evenly. A move-in-ready home in a sought-after mainline or bayfront block can still draw immediate activity, while a dated property at a heavy price can sit for months. The September data is why I keep saying the county number is context, and the street-level comparison sale is the answer.
What Should Buyers Take Away?
Start with the county trend, then narrow to your town, neighborhood, and property type. Atlantic County's 4.2 months of supply still favors a seller who prices well, but it no longer forces buyers into the fast, high-pressure offers of a few years ago. Use the extra inventory to compare several homes, review the September sales in your target town, and negotiate on real items: price, inspection items, and timing. Know which financing program fits before you offer, whether that is a conventional loan, an NJHMFA first-time program, or a VA loan, because a strong pre-approval still wins the best homes.
What Should Sellers Take Away?
Higher countywide medians do not guarantee that a specific home will sell quickly or at a particular price. In a market where closed sales fell 14.6% in Atlantic County and buyers are closing below asking in the aggregate, the first 30 days of a listing matter more than ever: realistic pricing against true comparable sales, professional photography and video, an accurate and complete listing, and aggressive digital marketing. Those are exactly the areas where my selling strategy and Matterport 3D tours make the practical difference between a fast sale and a stale listing.
Sellers considering a fall or late-2026 launch should also read my analysis of what to expect after Labor Day in the fall 2026 market.
A Note on Condos and Townhouses
Condo and townhouse markets can diverge sharply from single-family trends within the same county, and this cycle the published condominium detail was thinner than the August report. The one clear signal: NJ REALTORS-based reporting pointed to about 4.5 months of condo supply in Cape May County in September, with sellers there receiving the lowest share of asking price statewide. If you are buying or selling a condo or townhouse at the shore, the right comparisons come from the condo market itself, not the single-family county median. My condo buyer's guide and condo seller's guide cover the paperwork, flood insurance, and financing questions those transactions raise.
Frequently Asked Questions
What was New Jersey's median single-family home price in September 2026?
Are home prices still rising in Atlantic County?
Is the South Jersey market shifting in favor of buyers?
Why did closed sales and pending contracts drop in September?
Does the September median tell me what my home is worth?
Want the September Numbers for Your Town?
County statistics are the context; the comparable sales on your own block are the answer. If you are planning to buy or sell anywhere in Atlantic County or the Jersey Shore, I will walk you through the September closed and pending sales for your specific town and price range, show you what is currently competing with your property, and give you a straight, no-pressure read on what the numbers mean.
Contact Derek Doernbach with Your Jersey Shore Team at Century 21 Action Plus Realty for a complimentary, no-obligation Comprehensive Market Analysis of your property, or schedule a consultation to talk through your buying plan for the fall and winter market.
Derek Doernbach, Realtor®
Your Jersey Shore Team · Century 21 Action Plus Realty
Serving the Jersey Shore and Southern New Jersey
About Derek Doernbach
Derek Doernbach is a Realtor® with Your Jersey Shore Team at Century 21 Action Plus Realty, serving Atlantic County, Cape May County, and the Jersey Shore. Since obtaining his license in 2016 he has closed 192 transactions as a single agent and earned the New Jersey Realtors® Circle of Excellence Award every year since 2019. He combines honest guidance, professional photography and video, Matterport 3D Digital Twin tours, and AI-enhanced marketing to help sellers stand out and buyers make confident decisions. License: Salesperson, 1645208, NJ.
Explore Related Local Market Pages
County numbers are a starting point. Dig into a specific community or get the current snapshot on the market update page.
- Market Update: South Jersey & Jersey Shore Monthly Snapshot
- August 2026 Market Update: Prices, Inventory & Sales
- What to Expect After Labor Day: The Fall 2026 Shore Market
- Contact Derek for a Closer Look at Your Town
- Egg Harbor Township Community Guide
- Hammonton Community Guide
- How to Sell Your South Jersey Home for the Most Money
- Who Really Controls Mortgage Rates?
Sources and Reporting Notes
Primary statewide and Atlantic County figures come from the September 2026 New Jersey REALTORS® monthly indicators and Local Market Update reports, compiled from all New Jersey MLSs, with data current as of October 9, 2026 and accessed October 28, 2026. The reports calculate percentage changes using rounded figures; price and list-price-received measures do not account for sale concessions or down-payment assistance; small markets and small samples can produce large percentage swings; and the statewide report specifies a margin of error of ±4% at a 95% confidence level. Ocean County figures come from the Long & Foster market report for Ocean County (September 2026 vs. September 2025). Camden, Gloucester, Cumberland, and Salem figures come from MLS-based county market snapshots published in October 2026 and are labeled as such in the table because their property-type and definitional scope differ from the NJ REALTORS® report. Cape May and Burlington County September figures could not be reconciled at publish time and are intentionally omitted rather than reported inaccurately.
- New Jersey REALTORS® Local Market Update: Entire State (September 2026)
- New Jersey REALTORS® Local Market Update: Atlantic County (September 2026)
- Insider NJ: New Jersey Realtors September Housing Market Data
- 973 ESPN (Oct. 20, 2026): New Jersey Realtors data, first-nine-months statewide median up 3.8%
- nj.com (July 10, 2026): Cape May County year-to-date median through May 2026 up 19.7%
- Long & Foster Market Report: Ocean County, NJ (September 2026 vs. September 2025)
- Long & Foster Market Minute: Cape May County, NJ
- MLS county snapshot: Cumberland County (September 2026)
- MLS county snapshot: Camden County (September 2026)
- MLS county snapshot: Gloucester County (September 2026)
- MLS county snapshot: Salem County (September 2026)
- New Jersey REALTORS® Local Market Update: Burlington County (conflicting reports noted; not used)
Nothing on this page is financial, tax, or appraisal advice, and no statistic here is a promise of a future outcome. All residential real estate services are provided subject to New Jersey and federal Fair Housing law and the New Jersey Real Estate Commission's consumer information requirements.